Debugging
This page tries to explain the tools and strategies to debug programs build on top of VUEngine. But if you’re still stuck and need some help, feel free to reach out! You can find us, jorgeche and KR155E, and other developers on the Planet Virtual Boy forums and Discord.
When a build fails, you can, in the best case, just follow the error messages to find and fix the problem, and get the build to succeed again. Error messages can often be a bit cryptic, though. See below for info on how to diagnose build errors.
# Error diagnosis
Currently, there isn’t an interactive C debugger for the version of GCC bundled with VUEngine Studio. There are active efforts to patch it in and/or get the later to work with LLVM but for the time being, debugging is done through in game text output. There are a few handy macros defined in Printer.h that help to write such debug output code less tedious:
#define PRINT_TEXT(string, x, y)            Printer::text(string, x, y, NULL)
#define PRINT_INT(number, x, y)             Printer::int32(number, x, y, NULL)
#define PRINT_FLOAT(number, x, y)           Printer::float(number, x, y, 2, NULL)
#define PRINT_HEX(number, x, y)             Printer::hex(number, x, y, 8, NULL)
Mednafen’s debugger can come in handy to step through the disassembled code.
# Exceptions
Since the engine makes heavy use of pointer logic, it is really easy to trigger difficult to find bugs. In order to mitigate this issue, VUEngine provides an error facility that helps to catch when the code execution followed a logically invalid path.
Use the ASSERT or NM_ASSERT macros to test for a condition that, when not met, throws and exception:
ASSERT(NULL != object, "ClassName::methodName: NULL Object");
These macros should be used throughout the code to make debugging easier. Since the engine relies heavily on pointer usage, it is common to operate on a NULL or dangling pointer and get lost.
For example, the engine protects some singleton methods to prevent unintended side of effects produced by modifying part of the global state of the program from where they shouldn’t be modified. When trying to call the reset method of the BgmapTextureManager singleton, an exception will be thrown:
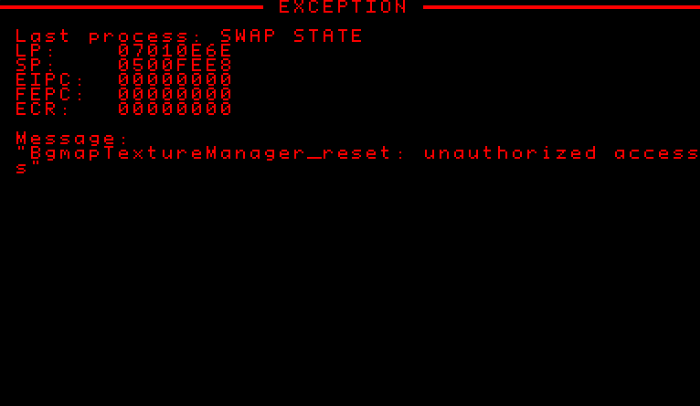
Exception screen
When an exception is thrown, you’re presented with some output that’s meant to help you find the exact location that is causing the crash. Looking for the message in both your game code as well as the engine would be the quickest thing to do and should give you only a rough idea of the problem’s root in most cases.
The most important information in the exception screen are the LP and the message. The message usually shows the class and the method where an assertion failed, while the LP value represents the return point in the binary of the code that made the call to method shown by the message.
The LP (linker pointer) value shows you the return point of the function in program where the crash occurred and will lead you to the code that has caused it. By enabling the Build: Dump Elf setting, the compiler will produce a file called machine-{MODE}.asm in the project’s build/working/ folder. It contains the dissassembled ROM. Search it for the LP value and it will lead you to the faulty function.
The SP (stack pointer) value becomes useful in the case of a stack overflow. By checking the SP value against the __bssEnd address in the output-{MODE}.map file, you can guess if there was one.
In the above example, the call to BgmapTextureManager::reset was made from the code address 0x7010E6E. Looking for that address in the disassembled code will reveal which part of the program tried to illegally call the method:
 7010e58:   aa 94           bne    7010f02 <_AnimationSchemesState_removeSprites+0xea>
 7010e5a:   a0 bf 01 07     movhi    1793, r0, r29
 7010e5e:   bd a3 cc f6     movea    -2356, r29, r29
 7010e62:   dd 00           mov    r29, r6
 7010e64:   00 ac f4 a3     jal    701b258 <_BgmapTextureManager_getInstance>
 7010e68:   ca 00           mov    r10, r6
 7010e6a:   00 ac 9e a0     jal    701af08 <_BgmapTextureManager_reset>
 7010e6e:   dd 00           mov    r29, r6
 7010e70:   00 ac e8 a3     jal    701b258 <_BgmapTextureManager_getInstance>
 7010e74:   ca 00           mov    r10, r6
 7010e76:   e0 40           mov    0, r7
 7010e78:   00 ac 4c a4     jal    701b2c4 <_BgmapTextureManager_clearBgmapSegment>
The above reveals that the illegal call is made from AnimationSchemesState::removeSprites, which leads to the C code:
void AnimationSchemesState::removeSprites()
{
    [...]
    /*
    * Cleaning graphics memory explicitly should not be done in general, the engine takes care of that
    * when swapping states. We do it here becuase BGMAP memory cannot be defragmented and loading non
    * shared textures would quickly deplete it.
    *
    * BgmapTextureManager::reset call is restricted so, this call will trigger an exception
    * in non release build modes!!!
    */
    BgmapTextureManager::reset(BgmapTextureManager::getInstance());
    BgmapTextureManager::clearBgmapSegment(BgmapTextureManager::getInstance(), 0);
}
# ASSERT
Only inserted when compiling under debug mode. It is used at the start of most of the engine’s methods to check that the this pointer is not NULL.
# NM_ASSERT
It is inserted in non release build modes. NM stands for “non maskable”. This macro is meant to be placed in sensible parts of the code that you want to catch when working under beta mode.
NM_ASSERT(!isDeleted(someObject), "ClassName::methodName: someObject is invalid");
# Other useful macros
To get the class name of an object, use the following macro:
__GET_CLASS_NAME(object)
Usually, it is used in conjunction with one of the printing macros:
PRINT_TEXT(__GET_CLASS_NAME(object), 1, 1);
To up or down cast an object safely, use the macro:
__GET_CAST(ClassName, object)
Usually, it is used in conjunction with an assert macro:
NM_ASSERT(NULL != __GET_CAST(ClassName, object), "ClassName::methodName: object is not a ClassName");
# Strategies
# Initialize everything
One of the most difficult and common source of hard to diagnose bugs are uninitialized variables; random crashes or completely strange behavior often are caused by that, so, make sure to properly initialized all of them.
# MemoryPool size
When things begin to break unexpectedly and in random places, it is almost guaranteed that either a rogue pointer or a stack overflow is the underlying cause. Try shrinking down the memory pools and test the game in debug mode.
Since the safe minimum for the stack is about 4KB, your memory pool configuration should not exceed 60KB (depending on how deep the stack can grow because of nested function calls, this limit could be lower; this is specially the case when compiling under debug mode).
# Safely cast everything
Because the engine implements class inheritance by accumulation of attributes’ definitions within macros, it is necessary to cast every object pointer in order to avoid compiler warnings when calling class methods. To save some typing, this is done implicitly by the traspiler for the class object. But other object arguments should be explicitly casted with:
ClassName::safeCast(someGenericPointer)
When compiling for release, this is replaced by a simple C type cast; while for debug, the Object::getCast method will be called, returning NULL if the object is not an instance of the provided class.